And Now the Rest of the Story
Allen S. Lefohn, Ph.D., President
A.S.L. & Associates
September 25, 2002
On September 23, 2002 the San Francisco Chronicle printed
a story summarizing the report, Code Red: America's Five Most
Polluted National Parks, prepared by environmental groups
who described The Great Smoky Mountains as the nation's most
polluted national park, with air quality rivaling that of Los
Angeles. Using park service data, the groups rated the Smokies
as the most polluted park in the country.
The report used a plant ozone-exposure index of 60 parts per
billion for comparison purposes. Ozone exposure numbers were
computed by adding the hourly average concentrations for all
hours experiencing 60 parts per billion or greater for the months
of April through October. According to the study, the Smokies'
average annual ozone exposure of 133,200 ppb-hours exceeded that
experienced in Atlanta, Knoxville, Tenn., and Charlotte, N.C.
Only one city in the study's analysis, Los Angeles with more
than 180,000 ppb-hours, exceeded the Smokies. Over the 11-year
period (1991-2001), the authors of the report stated that the
Great Smoky Mountains National Park experienced two times the
ozone exposure than in Knoxville, Tennessee and Atlanta, Georgia.
Figure 6 from the report is illustrated below. The figure
compares the average annual ozone exposure over the 11-year period
for 4 of the national parks with major metropolitan areas. The
report stated that the Great Smoky Mountains, Sequoia-Kings Canyon,
Yosemite, and Shenandoah National Parks experienced greater ozone
exposures than Charlotte, Atlanta, Knoxville, Washington D.C.,
New York City, Houston, Chicago, and Denver.
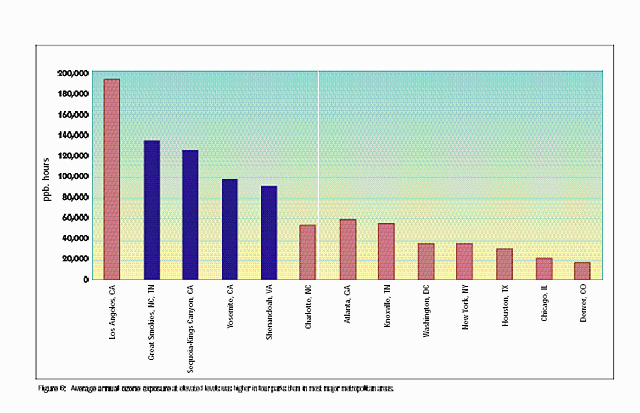
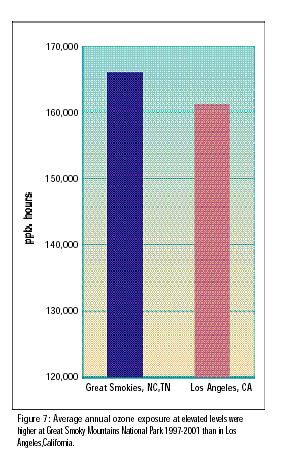
Figure 7 below, from the report, describes that the average
annual ozone exposure was higher at Great Smoky Mountains National
Park for 1997-2001 than at Los Angeles, California. Thus, the
report, Code Red: America's Five Most Polluted National Parks,
gives one the impression that the ozone exposures experienced
at the Great Smoky Mountains National Park for the period 1997-2001
were higher than Los Angeles and Houston, the two cities in the
United States that are competing for the highest national ozone
exposures.
And now, as Paul Harvey used to would say, it is time to
tell the Rest of the Story, the one that deals with the science
behind vegetation effects assessments. Based on scientific evidence,
we shall see that the Great Smoky Mountains National Park actually
does not experience ozone levels close to the values experienced
by Los Angeles.
In December 2000, the Federal Land Manager's Air Quality Related
Values Workgroup (FLAG) Phase I
Report was published. The authors of the report were the U.S.
Forest Service, National Park Service, and the U.S. Fish and
Wildlife Service. FLAG was formed
to develop a more consistent approach for the Federal Land Managers
to evaluate air pollution effects on their resources. Of particular
importance was the New Source Review program, especially in the
review of Prevention of Significant Deterioration of air quality
permit applications. The goals of FLAG
were to provide consistent policies and processes both for identifying
air quality related values (AQRVs) and for evaluating the effects
of air pollution on AQRVs, primarily those in Federal Class I
air quality areas, but in some instances, in Class II areas.
For protecting vegetation from ozone exposure, FLAG selected
a cumulative exposure index, similar to the one described in
the report, Code Red: America's Five Most Polluted National
Parks. However, based on years of research published in the
peer-reviewed literature, FLAG recognized the importance of the
potential for the higher hourly average ozone concentrations
(i.e., greater than or equal to 100 ppb) to affect vegetation
more than the mid-level (i.e., 60 - 90 ppb) and lower values
(below 60 ppb). FLAG recommended that both the cumulative exposure
index and the number of hours greater than or equal to 100
ppb be coupled together. Accounting for peak concentrations
provided FLAG with important information regarding the timing
of events and helped determine if a response was due to chronic
or acute ozone exposure. Also, as pointed out by FLAG, much of
the quantitative exposure/response information used by FLAG for
the determination of critical exposure ozone levels was generated
from experimentation based on fumigation treatments containing
numerous occurrences of high hourly average concentrations. Thus,
FLAG concluded that the concern about vegetation effects caused
by ozone was linked with both a high cumulative value and a large
number of hours greater than or equal to 100 ppb (N100).
Unfortunately the authors of the report, Code Red: America's
Five Most Polluted National Parks, did not couple the N100
exposure index with the cumulative index they characterized.
Given the fact that the National Park Service, the U.S. Forest
Service, and the Fish and Wildlife Service recommended the use
of the cumulative ozone exposure index similar to the one used
in the Code Red: America's Five Most Polluted National Parks
report AND the number of hours equal to and greater
than 100 ppb (N100), it is important to re-evaluate the ozone
data for the Great Smoky Mountains National Park and Los Angeles
based on the FLAG recommendations. The figure below illustrates
the use of the cumulative ozone exposure index that is identical
to the one used in the Code Red: America's Five Most Polluted
National Park report. The actual name for the cumulative
exposure index is SUM06.
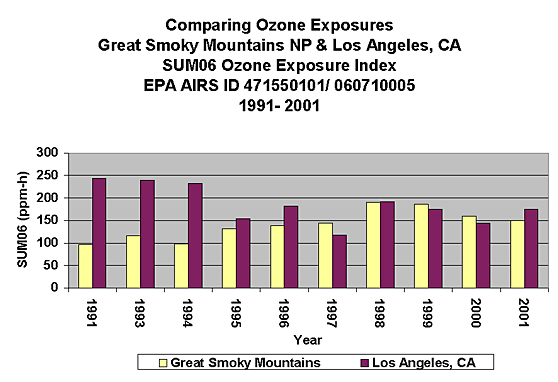
The figure shows that the SUM06 values for Los Angeles were
much higher in the earlier years than the values experienced
in the more recent years. California officials, as well as the
EPA, recognize that the Los Angeles area has decreased its ozone
levels considerably compared to the 1970s and 1980s. As pointed
out in the report, Great Smoky Mountains National Park experienced
SUM06 values similar in magnitude to those in Los Angeles for
the period 1997-2001. If one considers only the SUM06 exposure
index, the figure above tends to corroborate the conclusions
in the report. However, the figure below tells the Rest of
the Story.
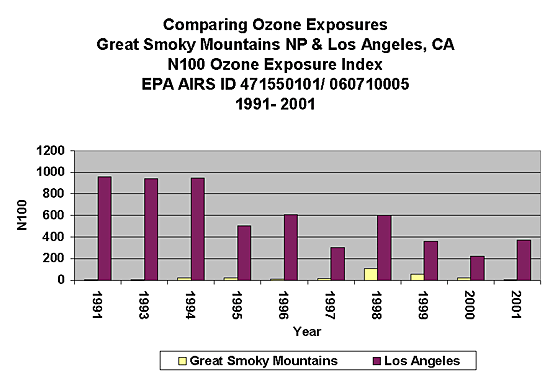
The figure shows that the number of hourly average ozone concentrations
for each year in Los Angeles greater than or equal to 100 ppb
(N100) is in the range 221 - 956. The range of the number of
hourly average concentrations greater than or equal to 100 ppb
for the Great Smoky Mountains National Park is in the range 1
- 107. Although the SUM06 cumulative exposure values, as shown
in the previous figure above, are similar for both locations
in the most recent years, the Los Angeles site experiences as
much as 956 times more hourly average concentrations greater
than or equal to 100 ppb than the Great Smoky Mountains National
Park site. In other words, there are far more hourly average
peak ozone concentrations occurring in Los Angeles than in the
Great Smoky Mountains National Park. Thus, FLAG's concern that
one might overestimate possible vegetation effects
if one uses only the cumulative exposure index instead of considering
both the cumulative exposure index and N100 values, has been
demonstrated in the report, Code Red: America's Five Most
Polluted National Park.
Should we be concerned about air pollution in our national
parks? The answer is definitely "YES". However, in
order for our nation's policymakers to make the best decisions
concerning our national parks that are in the interests of our
citizens, the public, politicians, and government officials must
be exposed to the best science available without simple sound
bites. The report, Code Red: America's Five Most Polluted
National Park, raises concerns about air pollution in our
national parks. However, the misinterpretation of scientific
data does not help those of us who work hard to protect our valuable
natural resources.
Dr. Allen S. Lefohn is an active research scientist who
focuses on developing exposure- and dose-response relationships
for predicting the effects of air pollution on vegetation and
human health. He was a co-author of the exposure-response section
of the EPA's Ozone Criteria Document in 1996 and authored several
sections of the EPA's 2006 Ozone Criteria Document. His cumulative
ozone exposure index, the W126, was adopted by FLAG as one of
its two ozone exposure indices for protecting vegetation and
the W126 index was proposed by EPA Clean Air Scientific Advisory
Committee (CASAC) and EPA Staff to the EPA Administrator as the
form for the secondary ozone standard to protect vegetation.
In 2008, based on advice from the White
House (Washington Post, April 8, 2008; Page D02), the
EPA Administrator decided to make the secondary ozone standard
the same as the primary 8-hour average standard. However, On September 16, 2009, the EPA announced it
would reconsider the 2008 national ambient air quality standards
(NAAQS) for ground-level ozone for both human health and environmental
effects. The Agency planned to propose any needed revisions to
the ozone standards by December 2009 and issue a final decision
by August 2010. On January 7, 2010, the EPA announced on its
web site its proposal to strengthen the national ambient air
quality standards for ground-level ozone. The EPA's proposal
decreased the 8-hour “primary” ozone standard level,
designed to protect public health, to a level within the range
of 0.060-0.070 parts per million (ppm). EPA proposed to establish
a distinct cumulative, seasonal “secondary” standard,
referred to as the W126 index, which was designed to protect sensitive
vegetation and ecosystems, including forests, parks, wildlife
refuges, and wilderness areas. EPA proposed to set the level
of the W126
secondary standard within the range of 7-15 ppm-hours. The proposed
revisions resulted from a reconsideration of the identical primary
and secondary ozone standards set at 0.075 ppm in March 2008.
On August 20, the Agency announced that it would delay its final
announcement to on or around the end of October. In early November,
the EPA announced that it would reach a final decision on the
ozone standards by December 31, 2010. On December 8, the EPA
announced that it would delay its final decision on the ozone
standards until July 2011. EPA announced on July 26 that it would
not make a decision on the ozone standards by its previously
announced deadline of July 29. On September 2, 2011, President
Obama requested that the EPA withdraw its proposed revised ozone
standards. On November 26, 2014, the EPA Administrator announced
that she was proposing an ozone human health (primary) standard
in the range of 65 to 70 ppb and would take comment on a standard
as low as 60 ppb. For the welfare (secondary) ozone standard,
she proposed that the standard be the same as the health standard
if the final health standard were set in the range of 65 to 70
ppb. The Administrator believed that a health standard in this
range would protect vegetation from ozone exposures of W126 values
within the range of 13-17 ppm-h. She also took comment on setting
a W126 value in the range of 7-13 ppm-h, which implied that she
was still considering establishing a secondary standard separate
in form from the human health 8-h standard. In August 2014, the
EPA Staff recommended to the Administrator that she select the
ozone primary standard at a specific level between 60-to-70-parts-per-billion.
For the secondary standard, the EPA Staff recommended that the
Administrator establish a 3-month, 12-h W126 secondary standard,
which would have a specific value within the range of 7 to 17
ppm-h. In October 2015, the Administrator concluded that protection
of vegetation from adverse effects could be provided by an 8-h
O3 standard of 70 ppb that restricted cumulative 3-month seasonal
W126 exposures to 17 ppm-hrs or lower. Follwing a review of the
2015 ozone standards, the Administrator on December 23, 2020
made the decision that both the human health and vegetation
ozone standards would remain at the current levels established
in 2015. Following this decision, on October 29, 2021, the Agency
announced it would reconsider the 2020 O3 NAAQS final action.
During the reconsideration process, CASAC recommended to the Administrator that
the form of the secondary standard should be changed to the cumulative
W126 exposure metric,
an index recommended by several previous CASAC ozone panels,
as well as at times by the EPA, to protect vegetation. CASAC
recommended that the Administrator consider that the level of
the W126 metric be in the range of 7 to 9 ppm-hrs. Upon considering
the CASAC recommendations for the human health and vegetation
ozone standards as part of the reconsideration process, in August
2023 the EPA decided to initiate a new review of the ozone NAAQS,
which meant that the entire ozone rulemaking process would begin
once again. The
current 70 ppb 8-h O3 standard promulgated in the US EPA's 2015
decision (Federal Register, 2015) serves as a surrogate to achieve
O3 levels at or below a W126 value of 17 ppm-hrs, which is above
the range of W126 values of 7 to 9 ppm-hrs recommended by CASAC. Dr. Lefohn
is a world authority on the subjects of exposure- and dose-response
of air pollution effects and the setting of air pollution standards.
Please see a list of his publications
for further information.
Home
Page | News
| Corporation | Maps
| Publications | Table
of Contents | Multimedia Center
Copyright ©
1995-2024 A.S.L. & Associates. All rights reserved.
|
|