
Yellowstone National Park, ©2004 Allen S. Lefohn
Ozone Exposures: The Status of
the National Parks - 2015-2017
Allen S. Lefohn, Ph.D.
A.S.L. & Associates
Helena, Montana 59601
August 9, 2018
Summary
The recent publishing of the EPA design values offers an opportunity
to quantitatively evaluate for the period 2015-2017 the status
of ozone exposures in the national parks in the United States.
Ozone data from 43 monitors in the US national park system were
evaluated for potential human health risk. Controlled human laboratory
studies have shown that there is a disproportionately greater
pulmonary function response from higher hourly average ozone
concentrations than from lower hourly average values. For establishing
the 2015 ozone standard of 0.070 ppm (70 ppb) for human health,
EPA mainly focused on the results associated with clinical studies.
While there are some sites in the national park system that experienced
frequent occurrences of elevated ozone concentrations, many ozone
monitoring sites in the park system experienced no or infrequent
occurrences of daily maximum 8-h average concentrations greater
than 70 ppb. Using the weighting methodology described in the
American Lung Association's State of the Air Report, 61% of the
monitoring sites in the park system received a grade of either
"A" or "B", 12% received a grade of "C",
and 28% received a grade of either "D" or "F".
The percent total is greater than 100% due to rounding. Both
the (a) Sequoia and Kings Canyon National Parks (NPs) and (b)
Joshua Tree National Park (NP) experienced some of the most frequent
enhanced ozone exposures in the park system. To better place
into perspective the ozone exposures experienced at these two
national park sites with the site experiencing the highest design
value in the United States, the ozone exposures experienced at
the two sites in California were compared with the site located
at Crestline in San Bernardino County, California. The Crestline
site is in the Los Angeles-South Coast Air Basin, which includes
all of Orange County and the non-desert regions of Los Angeles
County, Riverside County, and San Bernardino County. Many of
the highest ozone exposures in the Los Angeles-South Coast Air
Basin occur outside of Los Angeles County. The Crestline site
experienced a greater number of days in the high concentration
red (86-105 ppb) and purple (106-200 ppb) categories than the
two park sites. This reflects a greater risk to human health
at Crestline than at (a) Sequoia and Kings Canyon NPs and (b)
Joshua Tree NP.
Analyses
On July 24, 2018, the US EPA published design values (DV)
for ozone and other air pollutants on its website (https://www.epa.gov/air-trends/air-quality-design-values).
Design values are used to designate and classify nonattainment
areas, as well as to assess progress towards meeting the US National
Ambient Air Quality Standards (NAAQS). The recent publishing
of the EPA design values offers an opportunity to quantitatively
evaluate for the period 2015-2017 the status of ozone exposures
in the national parks in the United States. The level of the
current 8-hour ozone NAAQS is 0.070 parts per million (ppm),
which is commonly referred to as 70 parts per billion (ppb).
The ozone design value calculated by the EPA is the 3-year average
of the annual 4th highest daily maximum 8-hour ozone concentration.
In addition to publishing design values, the EPA also provides
guidance to the States and Tribes on informing the public on
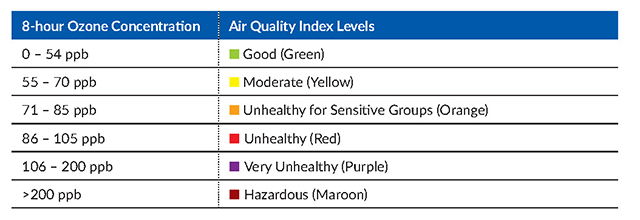
ozone concentrations experienced across the US. For informing
the public, the daily maximum 8-hour ozone values are summarized
in the form of an Air Quality Index (AQI). The index provides information how clean or polluted
the air is, and what associated health effects might be a concern
to the public. Daily maximum 8-hour ozone concentrations are
calculated from the hourly average ozone concentrations recorded.
Besides ozone, EPA calculates the AQI for four other major air
pollutants (particle pollution (also known as particulate matter),
carbon monoxide, sulfur dioxide, and nitrogen dioxide). For each
of these pollutants, EPA has established national air quality
standards to protect public health. The AQI for ozone corresponds
to the following daily maximum 8-hour ozone concentrations:
For assessing the status of ozone 8-hour exposures in the
national parks, both the 3-year (2015-2017) design values calculated
by the EPA and the weighted mean of the (a) unhealthy for sensitive
groups, (b) unhealthy, (c) very unhealthy, and (d) hazardous
categories were calculated. For all monitoring sites in the US
for the period 2015-2017, no 8-hour ozone concentrations greater
than 200 ppb have been reported. Following the analytical methodology
used by the American Lung Association's annual State of the Air Report, a weighted mean
is calculated using weighting factors applied to each range of
daily 8-hour concentrations associated with the Air Quality Index
levels described above. The number of orange days (unhealthy
for sensitive groups) experienced by each county received a factor
of 1; red days (unhealthy), a factor of 1.5; purple days (very
unhealthy), a factor of 2; and maroon days (hazardous), a factor
of 2.5. The greater weighting to the higher daily maximum 8-hour
ozone values follows the scientific results associated with clinical
studies for lung function decrement. Controlled human laboratory
studies have shown that there is a disproportionately greater
pulmonary function response from higher hourly average ozone
concentrations than from lower hourly average values. Therefore,
the simple addition of the number of daily maximum 8-hour concentrations
above 70 ppb does not adequately reflect the potential human
health risk associated with ozone exposures because all concentrations
are treated equivalently for potential impact. A weighting scheme
as outlined above for the daily maximum 8-hour concentrations
reflects the clinical study results on which the 2015 ozone standard
for human health is based. For more information on this subject,
please see Section 2 and the Supplement File of the 24-authored
paper by Lefohn et al. (2018), Tropospheric Ozone Assessment Report: Global
ozone metrics for climate change, human health, and crop/ecosystem
research and the US Federal Register summarizing EPA's decision
on the 2015 ozone standard.
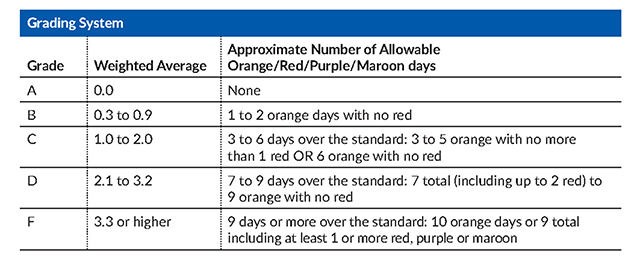
The weighted average approach provides greater weight for
those days when ozone levels are higher compared to those levels
when the values are lower but still above 70 ppb. For calculating
the weighted average for the period 2015-2017, the total number
of days within each AQI category as noted above is multiplied
by their assigned factor and then summed to calculate a total.
The total is divided by three to determine the weighted average
over the three-year period 2015-2017.
Applying the American Lung Association's methodology, the
weighted average defines a letter grade as follows:
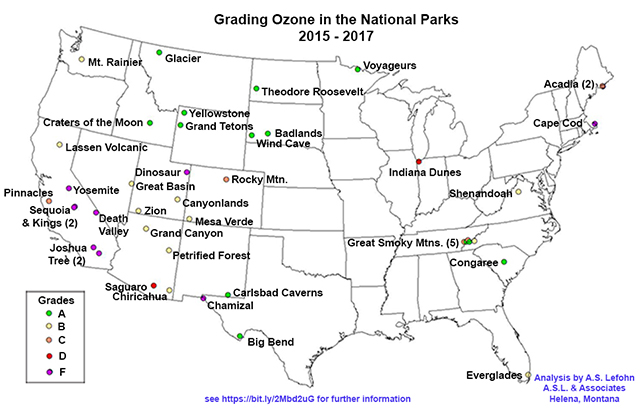
Applying the methodology described above, data from the 43
ozone monitors located in the national park system were analyzed.
The figure below summarizes the analysis.
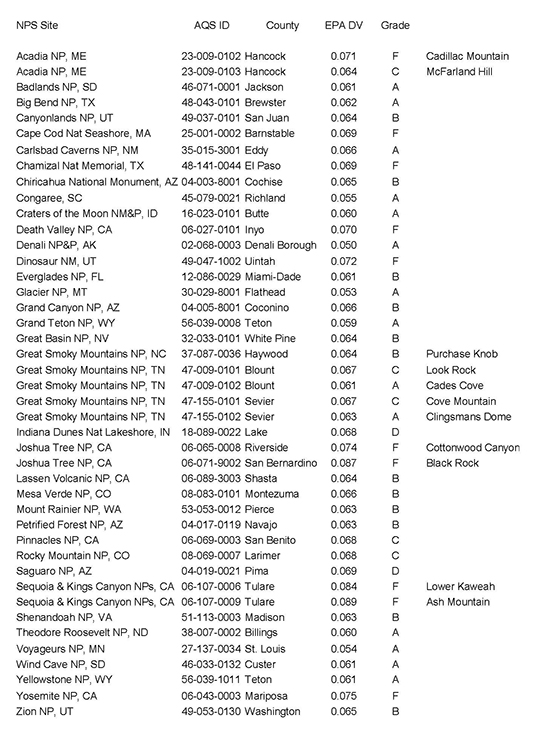
The table below represents the results.
The grading scores for the 43 monitors are summarized as follows:
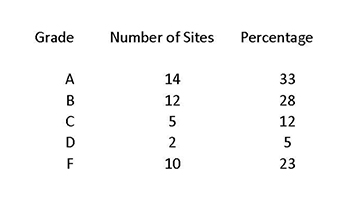
Percentage total is greater than 100% due to rounding
Sixty-one percent of the monitoring sites in the park system
received a grade of either "A" or "B", 12%
received a grade of "C", and 28% received a grade of
either "D" or "F". The following 12 monitoring
sites of the 43 sites in the national park system received either
a grade of "D" or "F":
Acadia NP, ME (23-009-0102)
Cape Cod Nat Seashore, MA (25-001-0002)
Chamizal Nat Memorial, TX (48-141-0044)
Death Valley NP, CA (06-027-0101)
Dinosaur NM, UT (49-047-1002)
Indiana Dunes Nat Lakeshore, IN (18-089-0022)
Joshua Tree NP, CA (06-065-0008)
Joshua Tree NP, CA (06-071-9002)
Saguaro NP, AZ (04-019-0021)
Sequoia & Kings Canyon NPs, CA (06-107-0006)
Sequoia & Kings Canyon NPs, CA (06-107-0009)
Yosemite NP, CA (06-043-0003)
For the 2015-2017, the two highest weighted averages of the
sites analyzed were experienced in Sequoia and Kings Canyon NPs
(06-107-0009 and 06-107-0006). Ozone levels at Sequoia &
Kings Canyon NPs are downwind of many air pollution sources,
including agriculture, industry, major highways, and urban pollutants
from as far away as the San Francisco Bay Area. The third highest
weighted average occurred in Joshua Tree NP (06-071-9002). The
Los Angeles basin, with a large population, is the major contributor
of ozone and other pollutants to Joshua Tree NP. A comparison
of the ozone levels at the highest Sequoia and Kings Canyon NPs
site and the Joshua Tree NP site was made with the site that
experienced the highest ozone design value and weighted average
in the United States. The site is located at Crestline in San
Bernardino County, California (AQS ID 06-071-0005). The Crestline
site is in the Los Angeles-South Coast Air Basin, which includes
all of Orange County and the non-desert regions of Los Angeles
County, Riverside County, and San Bernardino County. Many of
the highest ozone exposures in the Los Angeles-South Coast Air
Basin occur outside of Los Angeles County. The monitor is in
a residential area in San Bernardino County. There is a considerable
difference between the two park sites and the Crestline site
when comparing design values and weighted averages. The design
values and the weighted averages calculated for each of the three
sites are as follows:
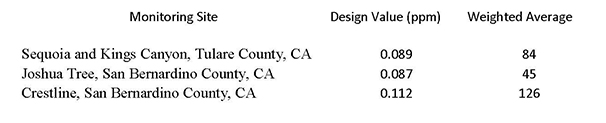
For 2015-2017, while both (a) Sequoia and Kings Canyon NPs
and (b) Joshua Tree NP experienced 35 and 12 days, respectively,
in the red category (i.e., 86-105 ppb range) and no occurrences
in the purple category (106-200 ppb range), the Crestline site
in San Bernardino, CA experienced 115 days in the red category
and 25 days in the purple (106-200 ppb) category. The Crestline
site experienced a greater number of days in the higher concentration
red and purple categories. While the two national park sites
experienced some of the highest ozone exposures in the national
parks, the exposures at Crestline reflect a greater risk to human
health.
Conclusion
While there are some sites in the park system that experience
frequent occurrences of elevated ozone concentrations, many ozone
monitoring sites in the park system experience zero or infrequent
occurrences of daily maximum 8-h average concentrations greater
than 70 ppb. Sixty-one percent of the monitoring sites in the
park system received a grade of either "A" or "B",
12% received a grade of "C", and 28% received a grade
of either "D" or "F". The percent total is
greater than 100% due to rounding. Both the (a) Sequoia and Kings
Canyon NPs and (b) Joshua Tree NP experienced some of the most
frequent enhanced ozone exposures in the park system. To better
place into perspective the ozone exposures experienced at these
two national park sites with the site experiencing the highest
design value in the United States, the ozone exposures experienced
at the two sites were compared with the site located at Crestline
in San Bernardino County, California. The Crestline site is in
the Los Angeles-South Coast Air Basin, which is composed of several
counties in the Los Angeles area. The Crestline site experienced
a greater number of days in the red (86-105 ppb) and purple (106-200
ppb) categories when compared to the two park sites. This reflects
a greater risk to human health at Crestline than at (a) Sequoia
and Kings Canyon NPs and (b) Joshua Tree NP.
Home
Page | News
| Corporation | Maps
| Publications | Table
of Contents | Multimedia Center
Updated August 27,
2018
Copyright © 1995-2026 A.S.L. & Associates. All rights
reserved.
|
|