On July, 16, 1997, the U.S. Environmental
Protection Agency (EPA) Administrator signed regulations that
will result in the promulgation of new surface ozone and particulate
matter standards in the U.S. For surface ozone, EPA will be phasing
out and replacing the 1-hour primary standard (maximum hourly
average of 0.12 ppm) with a new 8-hour standard, assessed over
rolling three-year periods, designed to protect against longer
exposure periods. The 1-hour standard will not be revoked in
a given area until that area has achieved three consecutive years
of air quality data meeting the old standard. The idea is to
ensure a smooth, legal, and practical transition to the new longer
time base standard. Determination of whether violations of the
new standard have occurred will be a much more complex affair
than before. The 4th highest 8-hour average daily maximum concentration
will be calculated for each year and averaged across an annually-rolling
3-year period, then rounded to the nearest 0.01 ppm. If this
value exceeds 0.08 ppm, then it is deemed to be in violation
of both the new 'primary' (protection of public health) and 'secondary'
(protection of vegetation) standards. The rounding convention
used by the Agency will mean that violations will not occur when
the 3-year average is less than 0.085 ppm.
There is considerable debate in the United
States on whether existing science can justify the level and
form of the 8-hour standard. One important issue is determining
the 'true' background ozone level in the United States. In the
new standards protocol, the EPA identified a range of background
levels of 0.03 to 0.05 ppm, and selected 0.04 ppm as the "theoretical"
natural background. This, however, is not even in accord with
data published by EPA themselves. In Chapter 4 of the EPA document
"Air Quality Criteria for Ozone and Related Photochemical
Oxidants" (1996), the hourly maximum concentration at all
of the remote sites was above 0.040 ppm. Using the data from
the sites listed in the document, for 1989, for instance, the
8-hour average daily maximum concentration at Theodore Roosevelt
National Park in North Dakota was over 0.07 ppm. In 1992, the
top ten 8-hour daily maximum concentrations in Yellowstone National
Park, Wyoming ranged from 0.06 to 0.07 ppm. All of the latter
occurred in the months of April and May, which would appear to
rule out any major impact of long-range transported photochemical
pollution.
Similarly, the U.S. Ozone Transport Assessment
Group's (OTAG) Air Quality Analysis Workgroup have, in its recent
final report, estimated background levels in rural areas surrounding
the OTAG region. Although the long-term arithmetic means of the
daily maximum 1-hour concentrations were in the range 0.03-0.05
ppm, the top ten 8-hour average daily maximum concentrations
were much higher: in the range 0.059-0.090 ppm.
In EPA's assessment of human biological
response to ozone, the choice of the natural background value
is also important. Whitfield and Richmond, in a paper presented
at the 89th Annual Meeting of the Air & Waste Management
Association (Nashville, Tennessee, 1996) indicated that human
risks could be overestimated by 10% to 37% if the background
level was closer to 0.06 ppm than 0.04 ppm. In laboratory experiments
on human health effects, researchers used "0" ppm ozone
controls; a level rarely attained in the lower atmosphere. It
is well known from vegetation experiments that control exposure
can seriously affect the level of significance of observed biological
results. The same may well apply to human health experiments.
If this turns out to be true, then the scientific basis for the
selection of 0.08 ppm as the 8-hour ozone standard would be seriously
compromised.
Finally, if background ozone levels are
indeed closer to 0.06 ppm than 0.04 ppm, then the 'law of diminishing
returns' dictates that it will be much more difficult to achieve
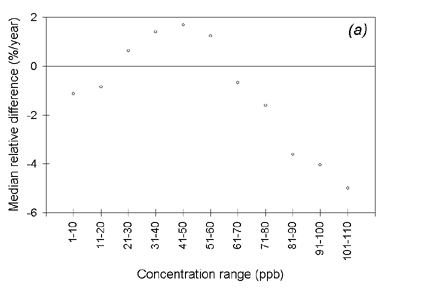
the legal limit of 0.08 ppm than EPA predicts. I have shown two
examples of this in Fig. 1, using sixteen years of hourly ozone
data from the EPA's Aerometric Information Retrieval System.
In Fig. 1 (a), taking Milwaukee County as a typical example,
it can be seen that the greatest rate of reductions in the hourly
average concentrations occurs at both the high and low end of
the distribution. There has been a greater increase in the 'mid'
concentration range. In other words, while it has proved relatively
'easy' to reduce the very highest ozone concentrations, reductions
at the 0.08 ppm level have been-and will continue to be-much
harder to achieve.
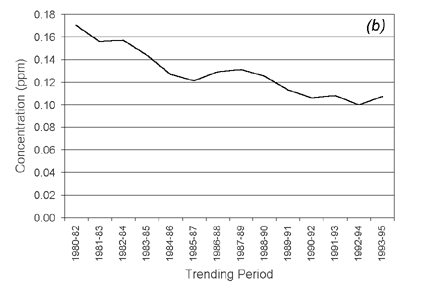
The result of this increasing resistance
to improvement can be seen graphically in Fig. 1 (b). Here I
have plotted the moving 3-year average of the fourth highest
8-hour daily maximum concentrations (i.e. the new EPA violation
criterion) for Fairfield, Connecticut. Although there was a relatively
rapid decrease in ozone levels in the early eighties, there is
evidence that the trend has slowed in recent years, yet the values
still exceed the new EPA standard. All of the empirical evidence,
therefore suggests for most sites that presently violate the
8-hour ozone standard, attainment of the new standards may prove
elusive.


