|
|
|
|
|
|
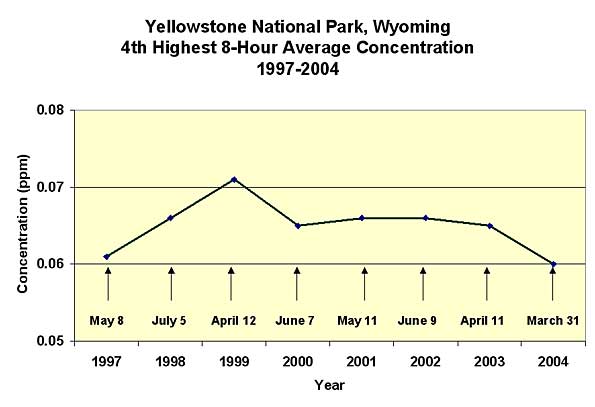
Ozone Trends in Yellowstone National Park (Wyoming) In 1996, the physical location of the monitoring site at Yellowstone National Park was changed and this resulted in two distinct sets of data (1988-1995 and 1997-2005) being generated. Thus, any attempt to identify current trends at Yellowstone National Park should begin in 1997 and not in 1988 due to the change in monitor locations. The first year of monitoring at the new location (AQS ID 560391011) had incomplete data in 1996 (4099 observations). The figure below illustrates the 4th highest 8-hour average concentration for the 1997-2004 period. The dates below the data points identify the day in which the 4th highest 8-hour average concentration value occurred.
Please note that 88% of the 4th highest 8-hour average daily maximum concentrations occurred during the springtime. Only one of the 4th highest 8-hour average concentrations occurred during the summertime (i.e., 1998). The spring of 1999 experienced the highest frequency of hourly average concentrations greater than or equal to 0.05 ppm for the period 1988 - 2005. Lefohn et al. (2001) attribute elevated springtime hourly average concentrations to stratospheric origin, which is not mainly due to anthropogenic sources. Naturally occurring enhanced ozone concentrations in the springtime occur at high-elevation monitoring sites in Canada, United States, China, and other locations in the world. Similar enhancements for surface ozone were observed in the springtime during preindustrial times. Low spatially resolved models, such as GEOS-Chem, have a difficult time adequately capturing the stratospheric-tropospheric exchange that is responsible for the elevated ozone levels that occur during springtime at high-elevation monitoring sites.
Some of the data identifying the 4th highest 8-hour average ozone concentrations used in the National Park Service's trends analysis were more than likely associated with naturally occurring processes. When we performed our trends analysis, we attempted to eliminate the effects of the naturally occurring ozone concentrations by focusing on the warm season months. The EPA did not attempt to perform an ozone trends analysis for Yellowstone National Park due to the change in site location (U.S. EPA, 2006). Oltmans et al. (2006) performed a trends analysis using ozone data from Yellowstone National Park and did not report a statistically significant trend in surface ozone for the park. For the period 2000-2014, using data from the TOAR I database (Schultz et al., 2017) and the Mann-Kendall nonparametric test, no statistically significant trends at the p < 0.05 value were observed at the Yellowstone National Park using the seasonal (April-September) 4th highest 8-h daily maximum concentration. Using all available hourly average data, no statistically significant trend for the the 4th highest daily maximum 8-hour average ozone concentrations at the p < 0.05 value at Yellowstone National Park was observed for any 15-year period over a moving 15-year period beginning in 1997 and ending in 2025.
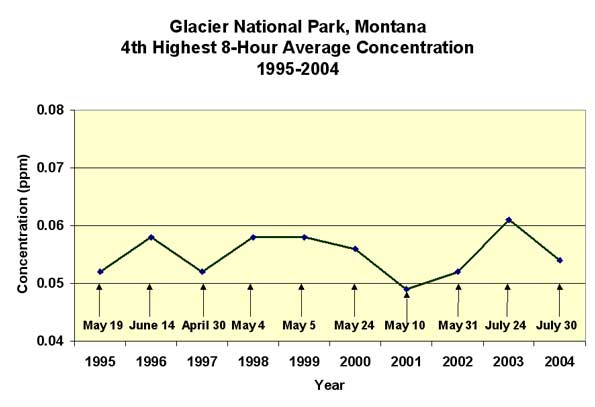
Ozone Trends in Glacier National Park (Montana) The 4th highest 8-hour average concentrations for Glacier National Park in Montana for the period 1995 - 2004 are shown below.
Please note that 80% of the 4th highest 8-hour average daily maximum concentrations occurred during the springtime. Only two of the 4th highest 8-hour average concentrations occurred during the summertime (i.e., 2003 and 2004). Because outlier values sometimes define trending, it is important to investigate possible reasons for outlier concentrations of ozone. The high outlier 0.061 ppm value for 2003 occurred during July. If one reviews the fire history data for Glacier National Park, one finds that the fires of 2003 saw the burning of over 144,000 acres in the park, and over 142,000 acres in surrounding areas. The fires occurred during July and August 2003. In evaluating the hourly average ozone data, one finds that hourly average concentrations between 60 and 79 ppm frequently occurred during the months of July and August at the Glacier National Park monitoring site. Based on a review of the fire data, it appears that the 4th highest 8-hour average concentration of 0.061 ppm that occurred in July 2003 was more than likely due to fires either in or near the park.
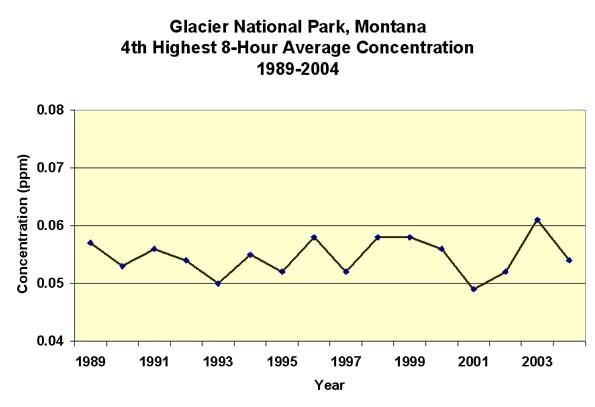
In performing trends analysis, it is important to include as much data as available to obtain a realistic view of the concentration time series. The figure below illustrates the data for Glacier National Park for 1989-2004.
Note that for the figure above, except for the anomalous reading in 2003 due to fires in the area, normal variation of ozone levels appear to be occurring from year to year. There appears to be no indication of ozone trending for the Glacier National Park site for the period of record. Neither the U.S. EPA (EPA, 2006) nor Oltmans et al. (2006, 2013) reported trends for Glacier National Park. This agrees with A.S.L. & Associates' latest trends analysis using data through the year 2025 and the Mann-Kendall nonparametric test.
References
Lefohn A.S., Oltmans S.J. , Dann T. , and Singh H.B. (2001) Present-day variability of background ozone in the lower troposphere. J. Geophys. Res., 106 (D9):9945-9958.
Oltmans S. J., Lefohn A. S., Harris J. M., Galbally I., Scheel H. E., Bodeker G., Brunke E., Claude H., Tarasick D., Johnson B.J., Simmonds P., Shadwick D., Anlauf K., Hayden K., Schmidlin F., Fujimoto T., Akagi K., Meyer C., Nichol S., Davies J., Redondas A., and Cuevas E. (2006) Long-term changes in tropospheric ozone. Atmospheric Environment. 40:3156-3173.
Oltmans S.J., et al. (2013). Recent tropospheric ozone changes - A pattern dominated by slow or no growth. Atmospheric Environment. 67: 331-351. https://doi.org/10.1016/j.atmosenv.2012.10.057.
Schultz, M.G. et al. (2017). Tropospheric Ozone Assessment Report: Database and Metrics Data of Global Surface Ozone Observations. Elementa 5(58). DOI: https://doi.org/10.1525/elementa.244.
U.S. Environmental Protection Agency (2006) Air Quality Criteria for Ozone and Related Photochemical Oxidants. Research Triangle Park, NC: Office of Research and Development; report no. EPA/600/R-05/004af.
|